
Decay V: Magnitude of the Western Crude Birth Rate
28. marts 2015
In this blog post, we debunk Vig and Nyborg's curious claim that UN has a "recommended" birth rate for all developed countries of 9.6. It's neither "recommended" nor does it have postulated value, meaning it is fabricated.
In Nyborg’s Decay article, the following assumption is made for the crude birth rate of “all developed countries”:
The UN-recommended birth rates for all developed countries of 9.6, reduced by 1/10 of a point from 2032 and again every seventh year forward (even though we had estimated it to be 9.3 at January 1st 2010 by a weighted average based on the UN-recommended foreign birth rates,
In her response to the UVVU on Dec. 14, 2012, the external demographic reviewer professor Lisbeth B. Knudsen is puzzled about this value, 9.6, and where it comes from. She is also puzzled about the qualifying claim that it is “UN recommended”. The thing is, the UN does not recommend any of their data or statistics. They just provide it, free of charge, to anyone interested, in great abundance, and easy to find. They provide direct access to their databases via their web site, and they also provide analyses, books, reports, Excel spread sheets and educational material. It is very easy to find anything you need, but it is not stated anywhere that the UN has ever “recommended” a birth rate of the Western nations of 9.6. In fact, according to Nyborg the value is not just 9.6, it is 9.60, which scientifically trained people immediately recognize as a number with far greater precision than 9.6. In his response to the UVVU hearings of Jan. 5, 2012, Nyborg writes:
The accusers still shows no understanding that the prognosis in the Decay article is based on stepwise varying birth rates for Danes, where the United Nations assigns all developed nations same birth rate (ie 9.60).
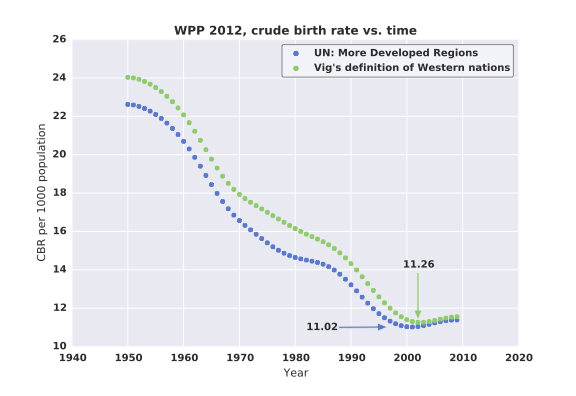
One reason that the UN does not “recommend” a value of 9.60 for the mean crude birth rate of Western nations, is that it has never been that low, in fact, it has never been below 11. In Figure 1, the actual, recorded population weighted crude birth rate from the UN can be seen, plotted vs. time. In their population statistics, UN conviniently provides an entry for “More Developed Regions”1, these values are plotted with blue points in Figure 1 The average value for the years 2003-2009, is 11.4.
PAID Editors think it’s an error
In the “Editor’s Note” Editors’ Note the committee appears to think that the number 9.6 is an error:
The use of the contested figure of 9.6 may also have been caused by error due to insufficient documentation of methods and the data file.
Nevertheless, in Appendix 1 to the “Editor’s Note” Nyborg & Vig contradict this finding of the comittee. In the following, we shall address these points one by one.
Item (1) UN link 1 and the documentation for 9.60
The “UN link 1” referenced by Nyborg & Vig clarifies that they had to resort to books.google.dk in order to locate the reference that allegedly is underlying the data used in the Decay article. According to the quoted Google search string the following terms have been searched:
- World+Population+Prospect
- crude+birth+rate
- more+developed+regions
Following “UN link 1” produces a page in Google Books, which can show individual pages of reference WPP2000. Further, Nyborg & Vig refer to Table 20, p. 50.
It is strange that Nyborg has to rely on Google Books to locate a source that is central to an already published scientific article, and in which it is precisely stated that the data originates from the United Nations. It is also strange that he must rely on old UN figures from 2000, when more recent data exists and is readily available from the same organization. It is in itself embarrassing and revealing that Nyborg has not realized that the data he must google to locate actually exists on the site (un.org/esa), where the data sources referenced in the Decay article is located. In fact, this is nothing more than a conspicuous attempt from Nyborg’s side at misleading the ad hoc committe and the editors and readers of Personality and Individual Differences (PAID).
In item (1) of Editors’ Note, Nyborg & Vig write:
(1) For so-called more developed countries, UN provides common CBRs with 6 figures for the period 2005–2015 for expected low and medium levels, respectively. When the figures for high levels are also considered, the average UN CBR amounts to 9.575. Interested readers will find the documentation for this in UN link 1 (see references).
This paragraph is ad verbatim translated from Danish and copied from Nyborg’s UVVU hearing response dated July 14, 2013, where he also cites the exact same “UN link 1”, Table I.20 as a reference for the figure 9.60. Therefore, we can repeat the exercise we carried out in our hearing response of Sep. 12, 2013:
For convienience, we have extracted the relevant data from Table I.20, page 50 of reference WPP2000, and find the $3 \times 2 = 6$ numbers marked “More developed regions”:
| More developed regions | 2005-2010 | 2010-2015 |
|---|---|---|
| Low variant | 9.3 | 8.9 |
| Medium variant | 10.1 | 10.0 |
| High variant | 11.2 | 11.3 |
In Editors’ Note Nyborg writes: “When the figures for the high variant are also considered, the average UN CBR amounts to 9.575.”
The average of the six numbers is actually 10.13. Rather, the number 9.575 results as the average of the four numbers in “Low” and “Medium” variant models. But Nyborg explicitly states that six figures were used to compute the number 9.6: “When the figures for the high variant are also considered...”.
The absurdity in calculating the average of a number of projections with different assumptions and premises is obvious: There is a reason that the UN makes three projections, a high, medium and low, and that they always use the “Medium” variant when communicating results to the public.
The bottomline is this: In order to justify the number 9.6, which in reality has been inventede by Vig, and which is a number Vig has used for years, Nyborg has succeeded in finding some old birth rate numbers for “More developed regions” from year 2000. He has then searched all combinations of averages until finding something close to 9.60. If this average was indeed the source of the figure, why not use the resulting number, 9.575 instead of 9.60? In addition, rounded to two decimal places 9.575 produces 9.58, not 9.60. There is no rational justification for taking the average of these four numbers — other than that the result is somewhat close to the desired number 9.60. This is quite simply, and quite obviously, an attempt to rationalize data of unknown origin, invented for the occasion, and an attempt to deceive first UVVU, and now the ad hoc committee.
Item (2), color-illustrated overview and dead links
In Appendix 1 to “Editor’s Note” Editors’ Note, Nyborg & Vig write:
(2) In 2010, UN presented the actual figure of CBR 9.60 for more developed countries in a color-illustrated Overview of the World Population Prospect. Unfortunately, the links to the tables under the address (UN link 2) are now empty. The missing sub-link was one of the following – UN link 3, 4, or 5 – and was located at the page referred to in UN link 6.
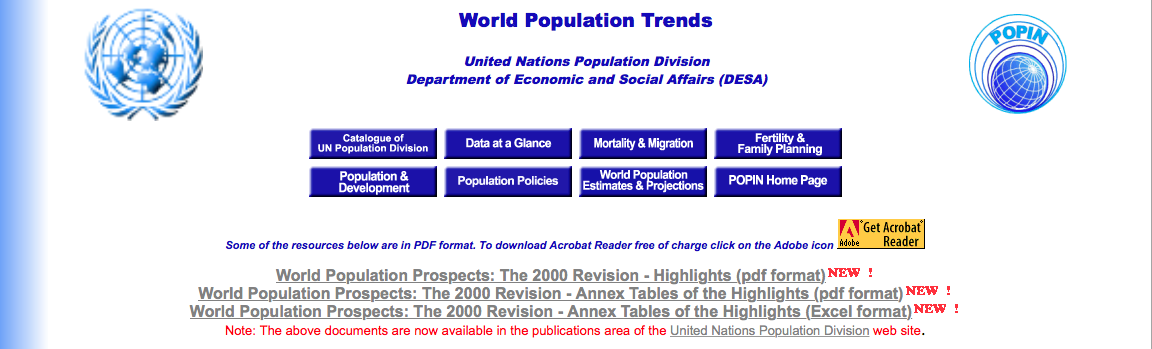
If you follow “UN link 2” you arrive at the web page shown in Figure 2 Nyborg is right that the three links in underlined, grey text are dead, and if you follow the link in the red note below, you will be taken to a site where the newest data from UN can be found.
According to Wayback Machine, “UN link 3” was available from Dec 15. 2001 to Dec. 8, 2002.
“Unfortunately, the links to the tables ... are now empty,” Nyborg & Vig write, and Nyborg wrote the exact same to UVVU in his hearing response of July 14, 2013. It is quite extraordinary that the editors of PAID accept defunct weblinks as scientific documentation, that must certainly be a first in the history of scientific publishing!
On the Internet, nothing dies
Fortunately, an archive of the UN website going back to 2001, can be found at archive.org, the so-called “Wayback Machine”. And here it can be seen that these links have been empty since 2001, with the exception of the link “highlights”, which can still be downloaded until 8 December 2002. So, these links have been dead in over 10 years and subsequently, it is a forgery when Nyborg postulates that the information for the Decay article has been downloaded from there.
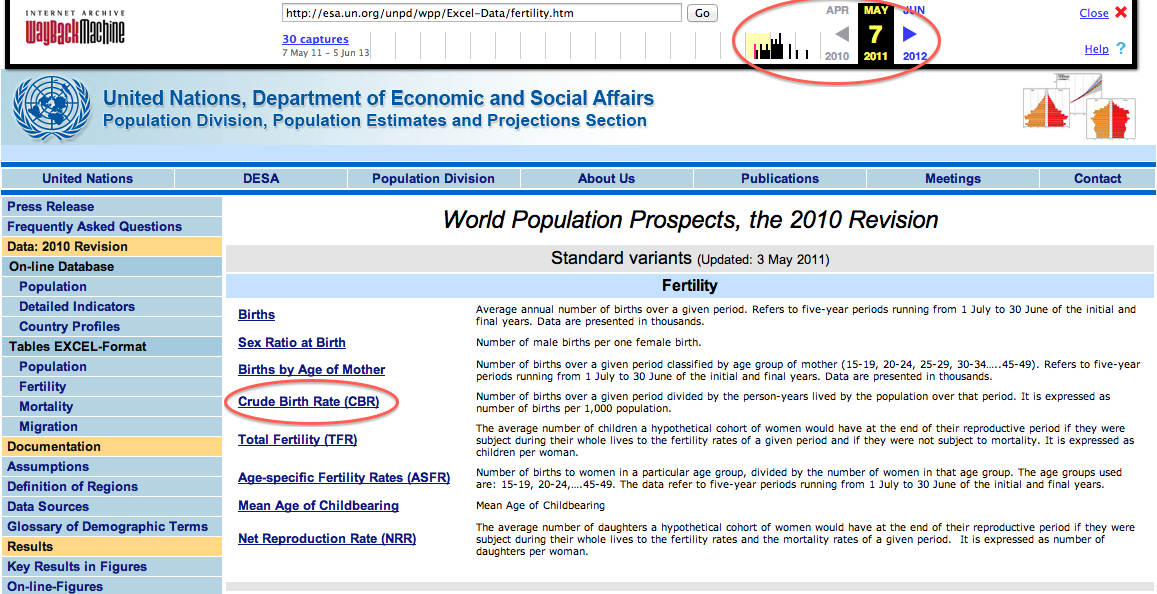
A screendump of the page is shown in Figure 3. As it is seen, the page refers to World Population Prospects, 2010 Revision, that Nyborg in his hearing response to the UVVU claims is the source of the number 9.60.
By clicking the link Crude Birth Rate (CBR) (marked with a red oval) you can download the Excel spreadsheet, in which Nyborg claims to have found data confirming that the number 9.60 is “Recommended” by the UN.
However, There are two problems associated with the claim from Nyborg.
-
The number 9.60 is not found in the spreadsheet.
-
Nyborg may not have used data from WPP 2010, when they were first published in May 2011, i.e. After the Decay article was Published on the PAID’s website on 2 November. April 2011. The photo above shows that the website was first found on 7 October. May 2011 (of the above is marked with a red oval, the red vertical bar indicates that this is the first version).
We submitted this spreadsheet to the UVVU as evidence in Exhibit T.
We now turn to the question of the “color-illustrated Overview of the World Population Prospect” that Nyborg & Vig claim document the “actual figure of CBR 9.60 for more developed countries” putatively “presented by UN” in 2010. Nyborg assumes he is safe from scrutiny, taking comfort in the assumption that the spreadsheet data cannot be retrieved from the website in question because the link is dead. He therefore believes that it is not possible to disprove that the number 9.60 comes from there.
Referring to an alleged non-existent document on the Internet is of course not a valid scientific reference, let alone documentation.
This ‘colour-illustrated Overview’ from WPP 2010 (which acturally is called Wall Chart 2010 and is part of the information material produced by UN), which Nyborg writes cannot be found anymore, we procured by contacting the UN’s Population Estimates and Projections Section, and it was submitted to the UVVU as evidence in Exhibit T.
‘Wall Chart 2010’ shows that CBR for “More developed regions” is 11 — not 9.60. Of course it is also found in the spreadsheet forming the basis for the chart (Exhibit S).
So, when you carry out the tedious but straightforward work it is to check the statements made by Nyborg, it is obvious that he systematically lies, misleads and manipulates.
-
There is no established convention for the designation of “developed” and “developing” countries or areas in the United Nations system. In common practice, Japan in Asia, Canada and the United States in northern America, Australia and New Zealand in Oceania, and Europe are considered “developed” regions or areas. ↩