Decay II: Analysis of the bogus "proportional transformation"
14. februar 2015
Here, we will analyse the so-called "proportional transformation" of the UN WFP 2007 data, and we will prove that only 11% of the 235 entries have been "transformed" as claimed by Nyborg. Most entries are simply fabricated by various means.
The transformation, which is not really proportional because every entry is multiplied by a separate factor, can be expressed mathematically:
where
- ${u_i}$ is a sequence of total fertility rate (TFR) data for countries $1…n$, allegedly from the UN World Population Prospects (WPP) 2007,
- $C={c_i}$ is a sequence of crude birth rates allegedly from Nationmaster 2008, and
- $T={t_i}$ is a sequence of TFRs, allegedly also from Nationmaster 2008.
This data construction produces a set $B$ of values that are on the scale of crude birth rates $C$, depending on the magnitude of the quotients ${u_i}/{u_i}$.
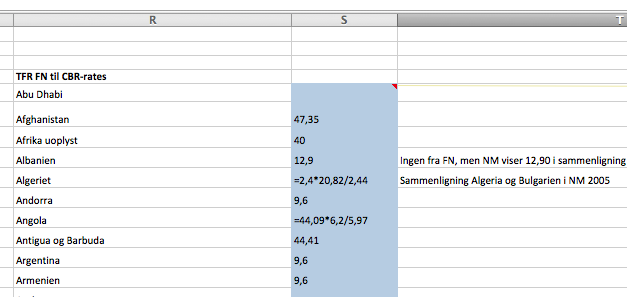
The list of crude birth rates (CBRs) constructed using the
“proportional transformation” $\eqref{eq:bogus}$ is found in the
supplementary Excel spreadsheet mmc1 sheet Data Fert.1,2,FN & IQ
sources, cells R5:S239. We have analyzed this data, (here termed
‘s0s’) in quite some detail.
Source of the CBRs
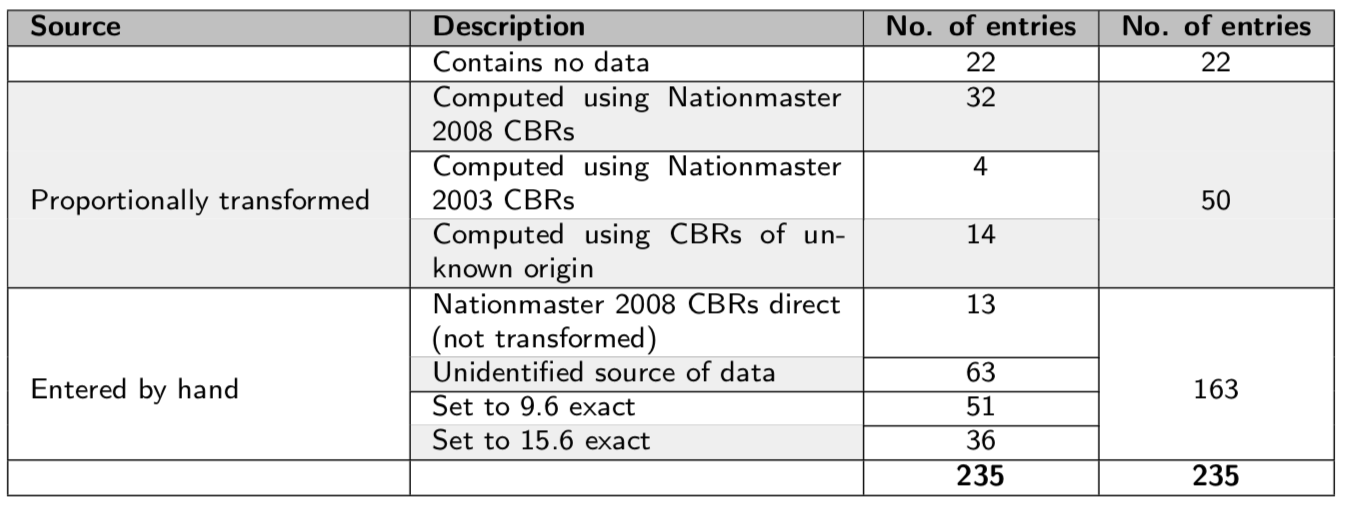
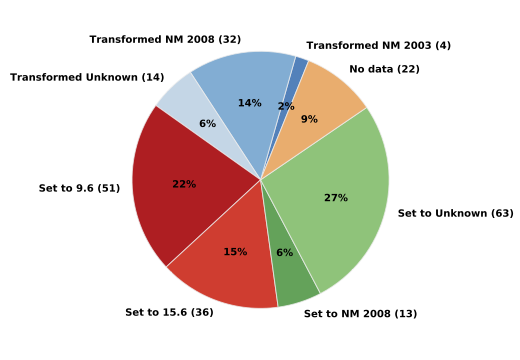
To determine the source of the set of CBRs $C = {c_i}$, we have searched Nationmaster’s CBR data of years 2003-2008 for matches of the entries $c_i$ from s0s. The result is shown in schematic form in Figure 2 and in tabular form in Table 1.
There are 235 entries in s0s, of these 22 (9%) contains no data (orange in Figure 2. Only 50 entries that have been computed using the “proportional transformation” procedure using equation $\eqref{eq:bogus}$ (shown in blue colors in Figure 2.) Of the 50 transformed CBRs, 32 can be verified to come from the Nationmaster CBR 2008 data set, and 4 are from Nationmaster’s CBR 2003 data set. The origin of 14 the 50 entries transformed crude birth rates cannot be determined.
Values for 163 entries have been typed directly into the spreadsheet without specifying a conversion formula, i.e. without using equation $\eqref{eq:bogus}$ (these are shown in red and green colors in Figure 2.)
Of the 163 “fixed” entries 51 represent more developed countries and have been set to 9.6, 36 represent less developed countries and have been set to 15.6. In other words, birth rates of “Western nations” are not actual crude birth rate data from any source, but have arbitrarily been set to the value of 9.6, which is stated (but not documented) in the Decay article as the so-called UN recommended birth rates. What is not stated is that the birth rates of a number of lesser developed countries is arbitrarily set to 15.6.
The source of crude birth rate data in 63 entries is unknown, and the values of the remaining 13 are identical to values from Nationmaster’s CBR 2008 data set.
The set of UN TFRs
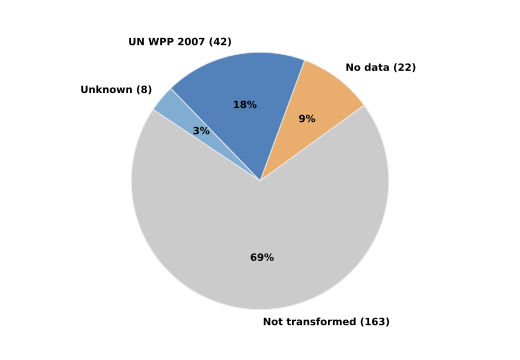
Next, we will look at the set of total fertility rates $U={u_i}$, allegedly from the UN WPP 2007 poster that is cited in the Decay article. These are used in the numerator of the quotient in $\eqref{eq:bogus}$. As stated above, only 50 of the 235 entries have actually been transformed using the “proportional transformation” $\eqref{eq:bogus}$. Of these 50 (shown in blue in Figure 3) 42 $u_i$ values can be verified to originate from the WFP 2007 poster, the remaining 8 have been invented or come from an unidentified source. A pie chart summarizing this data is seen in Figure 3.
The set of Nationmaster TFRs
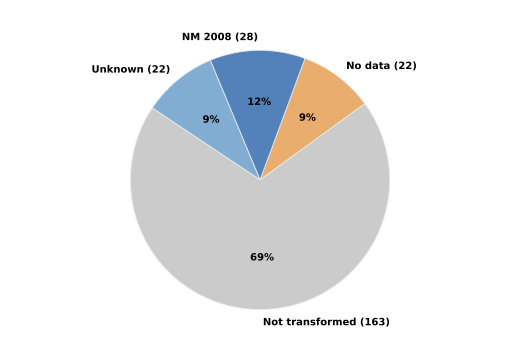
Finally we turn to the set $T={t_i}$ of TFR data, postulated to be used in the denominator of the quotient in $\eqref{eq:bogus}$. Only in 28 of the 50 entries the values of $t_i$ are from the Nationmaster 2008 TFR data set. The remaining 22 values have been invented or come from an unidentified source. Figure 4 shows a pie chart of the origin of these values.
Only 11% of 235 entries have been “transformed” as claimed
In summary, we have seen above that only 32 $c_i$ values, 42 $u_i$ values, and 28 $t_i$ values come from the sources claimed by Nyborg and Vig. But how many entries have the claimed source for $c_i$ and the claimed source for $u_i$ and the claimed source for $t_i$? The answer is 27. Twenty seven, or 11%, of the 235 entries have been transformed correctly according to the so-called “proportional transformation” $\eqref{eq:bogus}$.
The 27 countries for which the “proportional transformation” has been applied as claimed by Nyborg and Vig are: Egypt, Eritrea, Ethiopia, Kazakhstan, Laos, Malawi, Malaysia, Mozambique, Nepal, Nigeria, Oman, Philippines, Rwanda, Saudi Arabia, Senegal, Somalia, South Africa, Sri Lanka, Syria, Tajikistan, Tanzania, Thailand, Togo, Turkey, Uzbekistan, Zambia and Zimbabwe. For the remaining 208 entries, the data has been fabricated in various ways.